Evolution
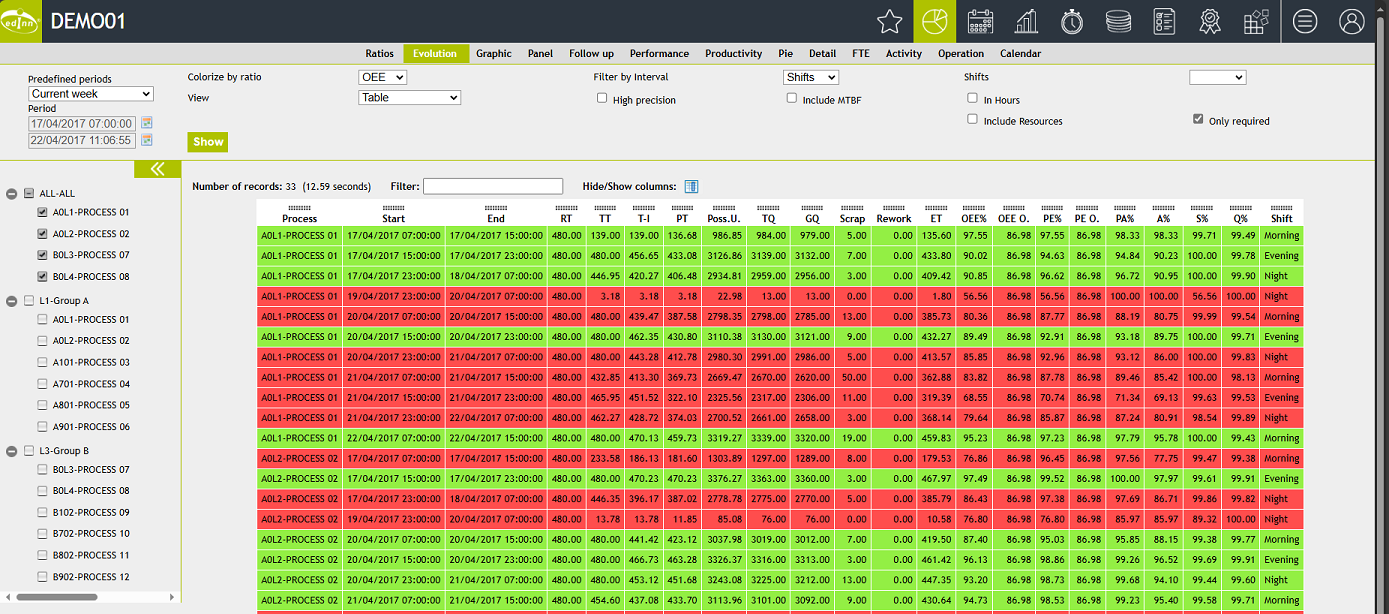
This report shows the evolution in time of the production efficiency ratios. It is, together with the report Ratios, one of the most useful reports regarding production efficiency. The reason is that it shows in colors how areas or processes are performing. The user can focus on analyzing only red areas and processes.
In addition to the functionality of the report ratios, this reports adds that it shows the evolution in time. That is useful to see if the organization is reducing certain losses or the results of certain actions or investments inside the organization.
Selectors are:
- Please see: "Common aspects"
- Colorize by ratio: perform the division of colors based on the following ratios: OEE, OCE, OPCE.
- Interval: the periods that will divide the records.
- Include MTBF: MTBF information will be included.
- Shifts: the shifts to show. This is useful to analyze the evolution of a certain shift.
- Include Resources: adds a column with the identifiers of the resources which did IN in the period.
- Only required: It only shows records which have demandable time, which is useful to hide periods not scheduled for production.