Graphic
This report shows the efficiency in a bars graphic, indicating the losses with a color code. The user can then click on the losses to see the detail.
This report is calculated both for processes and areas (groups of processes).
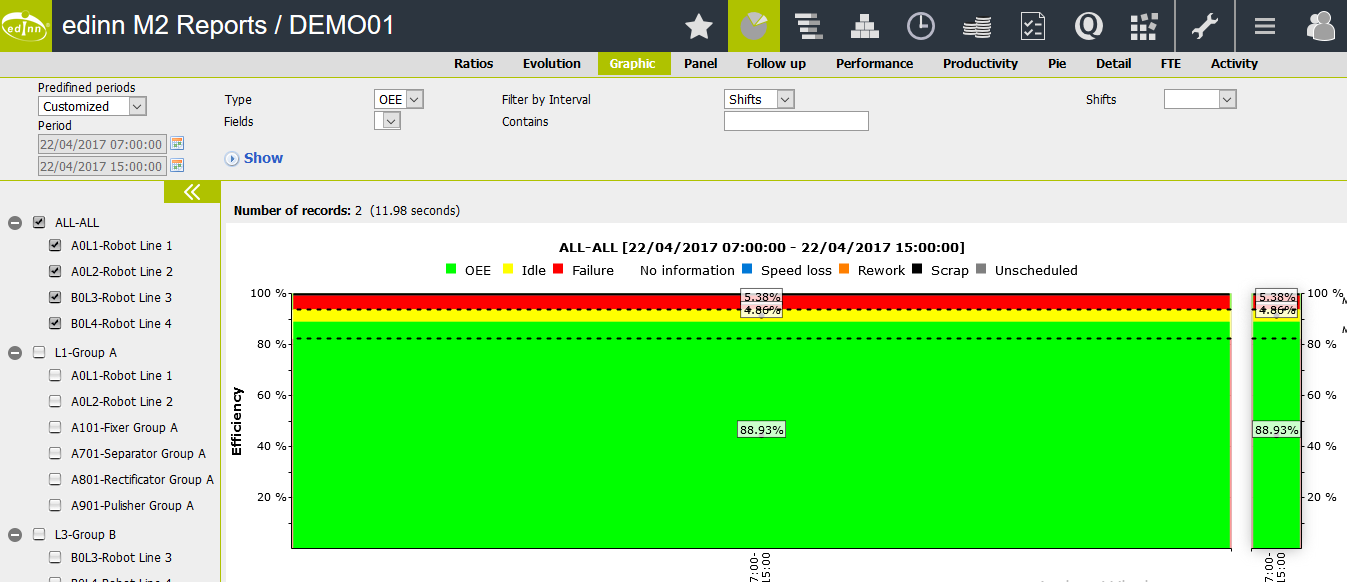
Selectors are:
- Please see: "Common aspects"
- Type: the type of ratio: OEE, PE.
- Fields: if you want fo filter production performed with a certain field with a certain value.
- Contains: what must be contained in the field selected in the previous selector.
- Interval: the periods that will divide the bars.
- Shifts: if you want to see just a certain shift.