Common aspects
The reports have the following functionalities:
- Graphic division by colors: dividing the information by colors improves and makes easier the user experience. For example, if you want to find the losses, you will only have to look for the information in red.
- Some reports can be expanded by clicking on the areas.
- Visualizing different reports by introducing only once the filtering parameters.
- Different types of visualization: tables with data or graphics (pies, bars, 3D, etc.)
- Showing the description of columns of the tables (if you have activated the tooltips function), by passing the mouse over.
- Comparing different reports at the same time by opening different tabs or internet explorers.
- Possibility to hide or show columns in the reports. This functionality will only apply to the user that performed it.
- Possibility to order tables based on columns.
All the reports have some common options and selectors:
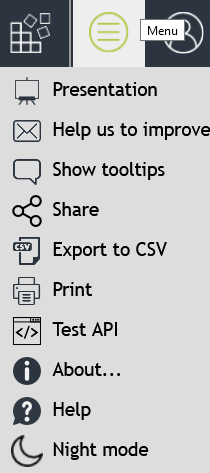
- Presentation: appears only when viewing dashboards. It activates the presentation mode, which consists in showing the current dashboard, at full screen, passing later automatically over all the dashboards every certain seconds. After activating this option, please try to put your web browser in full screen mode (each web browser has a different menu option or key combination for this purpose). In this option you will also be able to copy the link which will allow you to reproduce this presentation in other devices.
- Add to favorites (only available in certain reports): adds present report to the Favorites reports. If you have the Common Favorites role you can create the favorite for all users, otherwise the favorite report will be only accessible to you. Additionally, if the server has the "Cache of favorites" option activated, favorite reports will be automatically generated and stored in order to be shown instantaneously to users.
- Remote apps: appears only when remote applications have been enabled. Provides access to the page to download the direct accesses to the remote applications, usually the console and the operation terminal, published by a server. Executing remote apps can be necessary when:
- There is no other way of accessing the Console.
- The terminal works very slowly.
- The terminal does not work in the device (tablet, mobile phone, etc.) but Microsoft Windows Server remote applications do.
- Help us to improve: sends an email directly to the heardquarters of edinn. This will help us to improve the system for you.
- Show / Hide tooltips: shows or hides the pop-up help / support messages at fields and columns of reports.
- Send link: prepares an email with a link to the report. The receiver of the email can access the same report by clicking on the link and introducing its own username and password to access reports. The receiver should have permission to access reports.
- Export to CSV: allows to export data (not graphics) to a .CSV format which can be read by MS Excel or by an OpenOffice calculation sheet.
- Print: allows to print the report.
Note: When printing, keep in mind that the colors of the table cells, the elements of the graphs and the option boxes, will only be seen if you activate the "Background graphs" option in the printing options, found in the "more settings" or "advanced options" section depending on your browser.
- Test API: allows you to test edinn API calls without programming. Examples of use can be found in the API documentation.
- Backups: Allows to access the list of backups of your database if correctly configured. This option is only available for resources with super administrator role. Backups files will be compressed with the password indicated in the corresponding section of the console.
- About: shows the about section.
- Help: shows the help section.
- Night mode: switches to dark mode which is more suitable for low light environments.
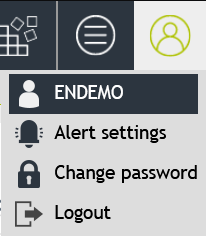
- Alert settings: allows you to change whe do you want to recive alerts by email.
- Change password: allows you to chage your password.
- Logout: close our session.
- Show report: show the selected report.
- Fields in each report:
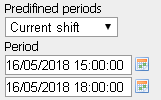
- Predefined periods: the report includes a series of predetermined periods, for faster access to information.
- Period: to enter the dates of the specific period of time to analyze.
- Area: selects the area or areas of processes to analyze.
- Process: selects the process or processes to analyze.
- High precision: higher precision, much more time to calculate. Most of the times the gain of precision is not necessary.
- In hours: it displays information in hours rather than minutes.
- View: table or 2D graphic.
- Areas and processes tree:
The operation of the area and process selector is as follows: If an area is selected, any report that can be executed for areas will appear with the data grouped by area.
Note: Please keep in mind that, in edinn, area ratios are not calculated as the sum of the components (quantities, times, etc.) of every subprocess, as additional mathematical calculations must be performed. The objective is to avoid that, for example, a process that works a little time and thus is not representative for the area but produces a lot more units that other processes of the same area could, when adding its quantities to the area, result in a high ratio when the ratio is actually low.
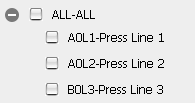
As shown in the image, the box for selecting the area and its child processes are marked.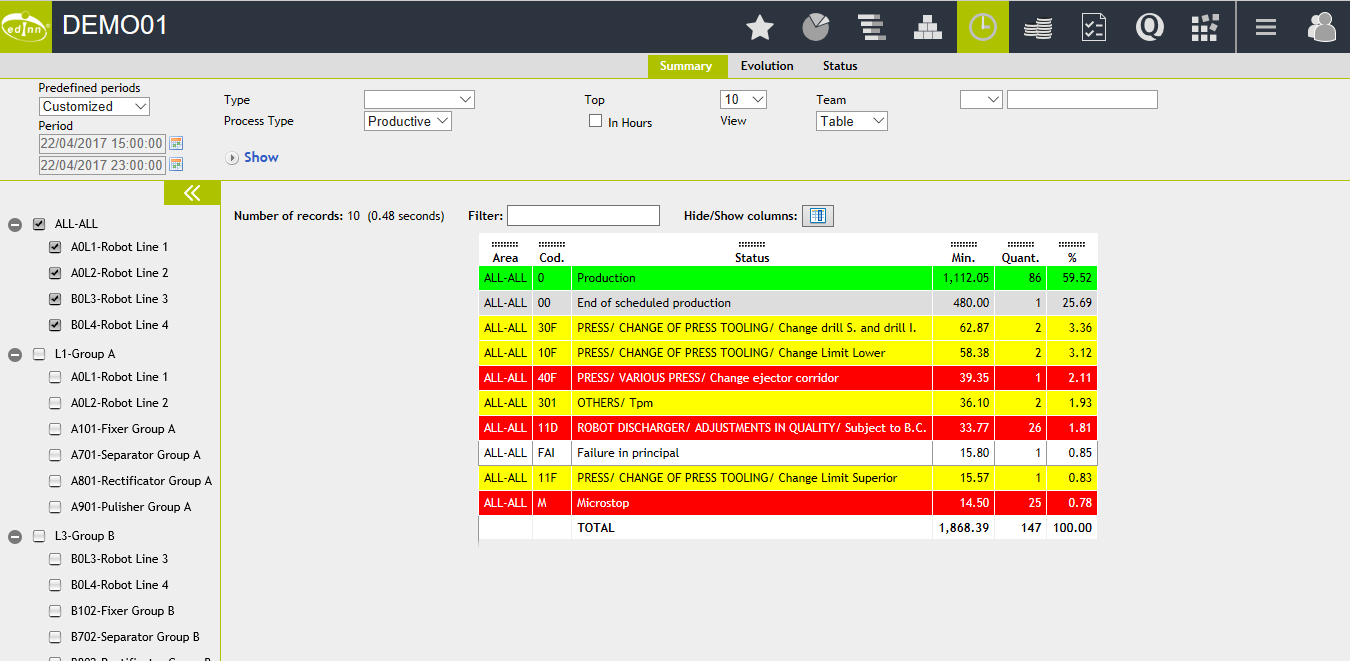
If you click again on the box of the area, it is marked with the "minus" symbol (-), but the boxes of the processes will remain marked and the report will be shown differentiating the data by process.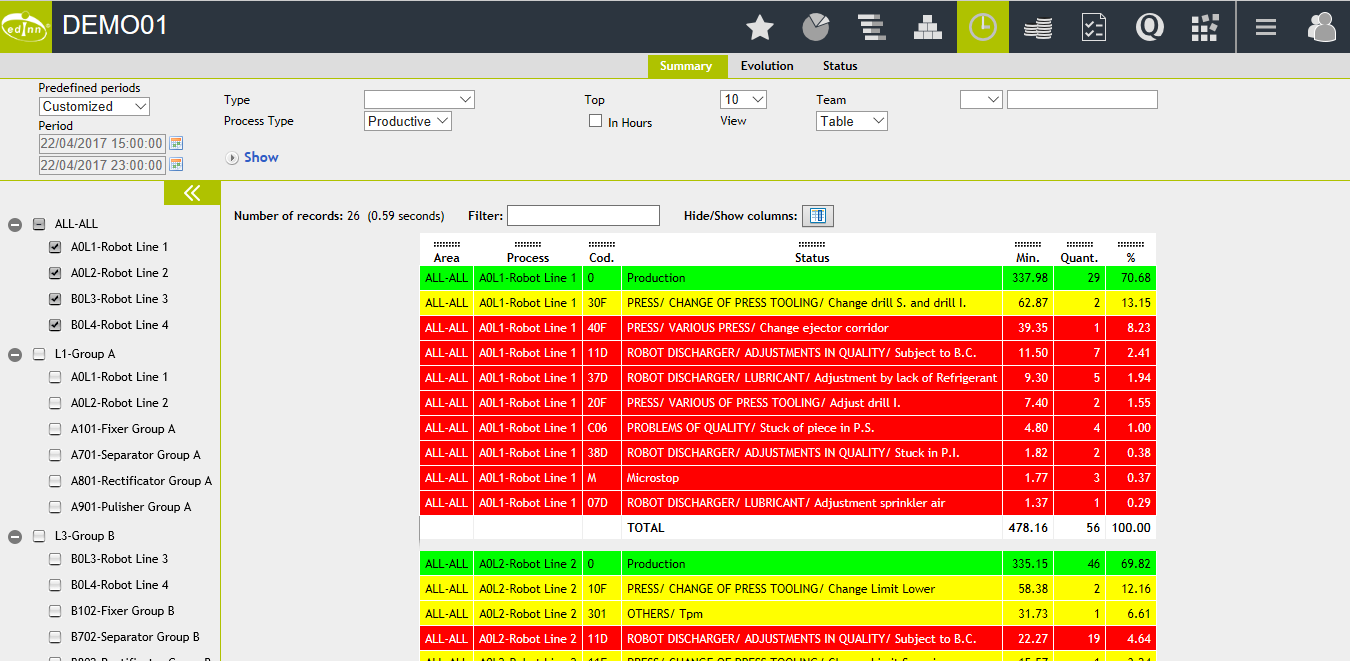
If you click again on the box, this and the child processes will be completely unchecked, there will be no area or process selected and the report will show the information of all the areas with the data grouped by area or, in the reports where required the selection of some area or process, will show the corresponding error message.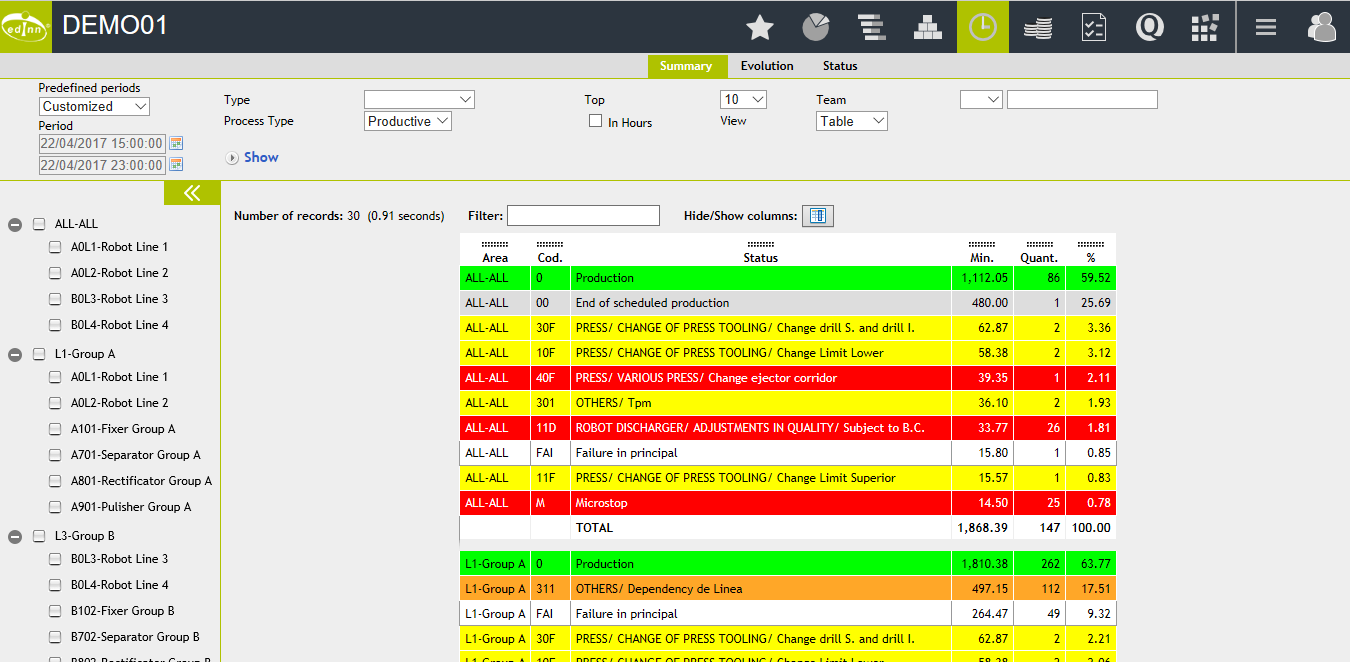
- Most of the reports perform weighted calculations to provide ratios more adjusted to reality. For example, if results where generated in a period where there was no production time, the results may be shown reduced or in a contiguous period which had production time. This can cause, specially in short periods between shifts, a mismatch between the totals of weighted and not weighted reports.
To view gross quantities, with no weighting, use the following reports:
Results |
Status |
Consumption |
Autocontrol |
Quality |
Registry |
|
|
|
|
|
|