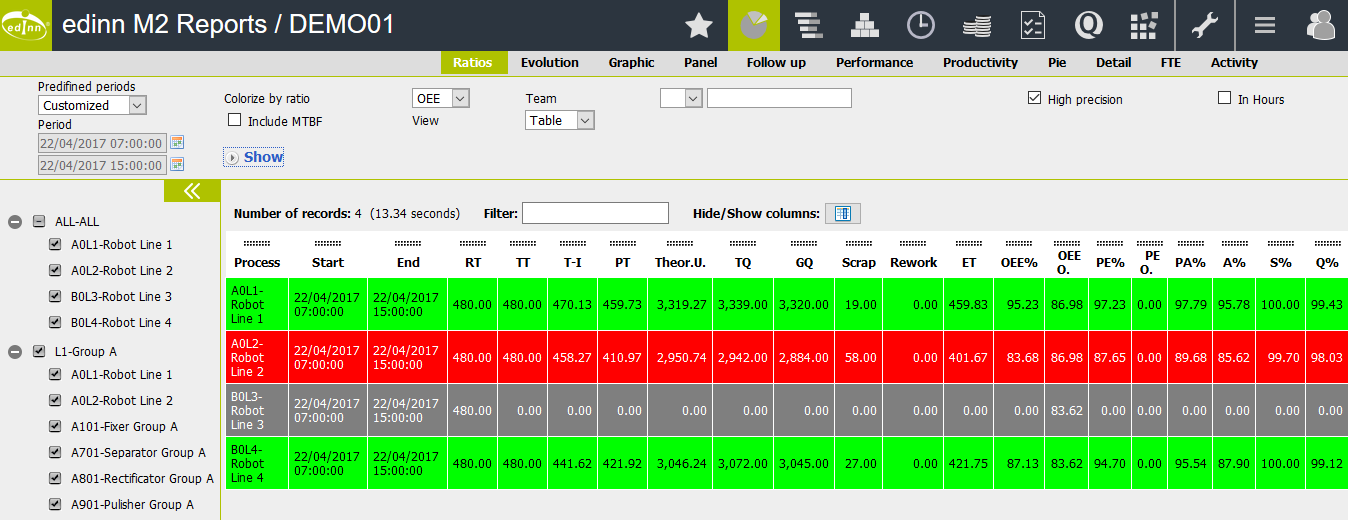
Ratios
This report shows the production efficiency ratios. It is one of the most useful reports regarding production efficiency. The reason is that it shows in colors how areas or processes are performing. The user can focus on analyzing only red areas and processes.
To find the reason why an area or process has losses (is red or yellow) simply click on the record.
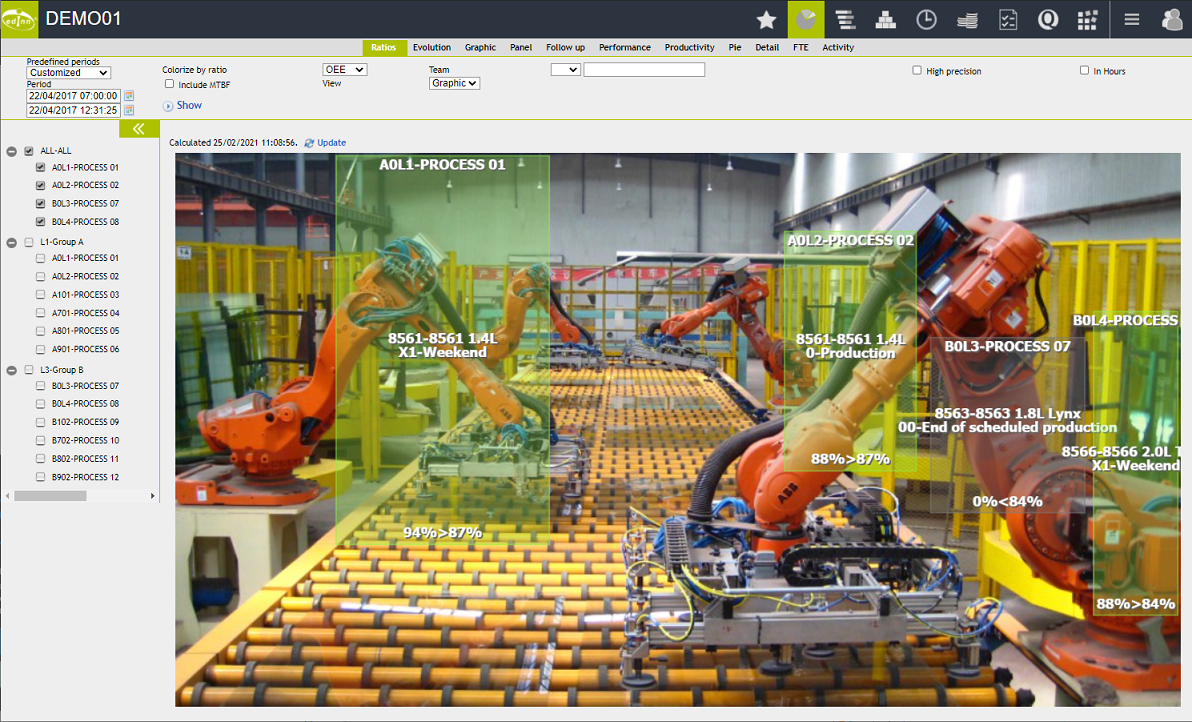
On this report, graphical lay-outs can be shown as in the image below, by selecting view graphic of an area which has a graphic configured:
Selectors are:
- Please see: "Common aspects"
- Colorize by ratio: perform the division of colors based on the following ratios: OEE, OCE, OPCE.
- Include MTBF: MTBF information will be included.
- Team: if you want to see only information relative to the times where that specific team was working.
- View: allow to view the information in a table or graphic format.