Dashboard
The dashboard shows through a table and a graph the production data in real time, relating it to the OEE:
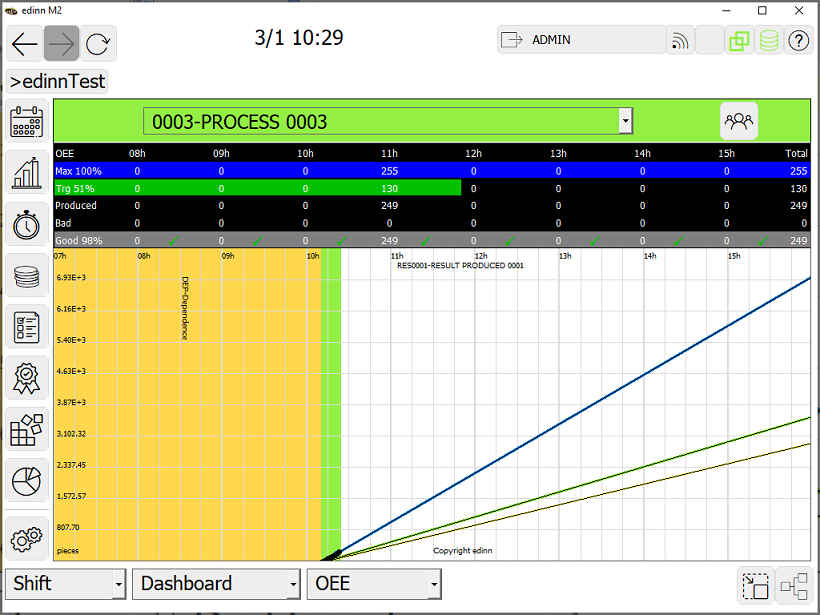
In the lower part the path of the process is shown. In the upper part the table shows different data classified by hours. The hours shown in the title of each column represent a time interval between the indicated time and the previous time (1 hour less). The fields shown by default are:
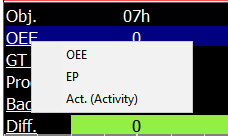
- First row: Pressing this button displays the menu with the following options:
- OEE: Maximum quantity that can be produced at 100% of OEE.
- EP: Maximum quantity that can be produced at 100% of EP (Productive efficiency).
- Act. (Activity): Maximum quantity that can be produced according to the activity ratio.
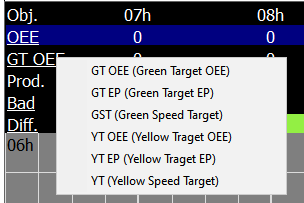
- Second row: Pressing this button brings up the menu with the options:
- GT OEE (Green OEE Target): Green OEE target for that process. If the process has produced more than the amount specified in this field, it will be colored green.
- GT EP (Green EP Target): Green EP target for that process. If the process has produced more than the amount specified in this field, it will be colored green.
- GTS (Green Speed Target): Green speed target for that process. If the process has produced more than the amount specified in this field, it will be colored green.
- YT OEE (Yellow OEE Target): Yellow speed target for that process. If the process has produced more than the amount specified in this field, it will be colored yellow.
- YT EP (Yellow EP Target): Yellow speed target for that process. If the process has produced more than the amount specified in this field, it will be colored yellow.
- YTS. (Yellow Speed Target): Yellow speed target for that process. If the process has produced more quantity than specified in this field, it will appear colored yellow.
- Third row. Produced: Amount produced. It includes good and bad quantities.
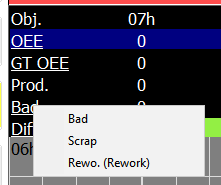
- Fourth row: When pressed, the menu appears with the following options:
- Bad: Bad quantity produced, which is the sum of the amount of scrap plus the amount of rework.
- Scrap: Amount of scrap.
- Rework: Amount of rework.
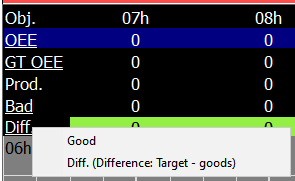
- Fifth row: Pressing this button displays the menu with the following options:
- Good: Good quantity produced.
- Diff.: Difference from the target.
Additionally, through server configuration, the dashboard can be customized with the following options:
- Accumulated: With this option, instead of hourly data, the accumulated data from the beginning of the period is shown every hour and the total column does not appear.