What is the "Path"?
The "Path" is a concept created and registered internationally by edinn®.
The idea behind it is that organizations need to see their correct "Path" of production to have the maximum possible information in order to quickly, easily and continuously improve.
There are different types of paths.
PRODUCTION PATH:
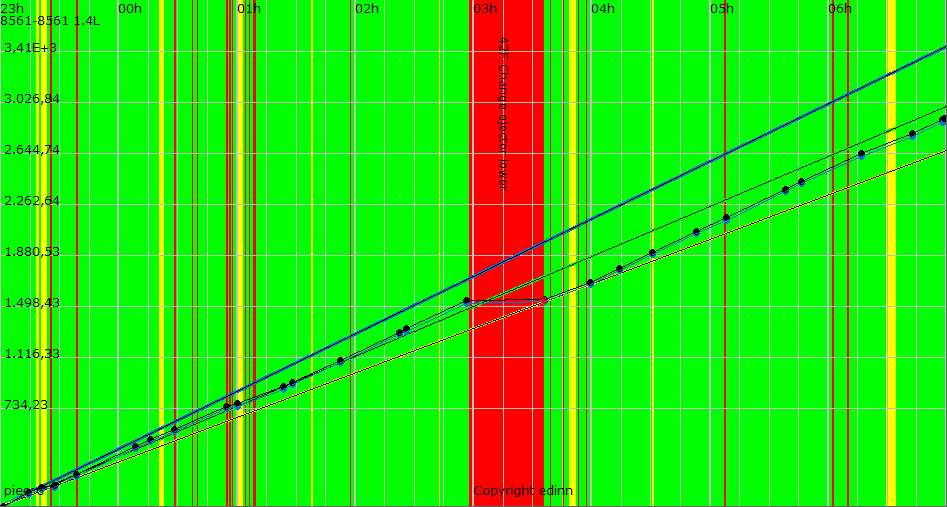
This "path" shows:
- X axis: shows the time passed.
- Y axis: shows the quantity of good results obtained.
- Color areas: are the statuses that the process has passed. Please refer to the color codes of statuses.
- Blue dots: it represents the production without taking into account speed losses (only the stops), which can be identified by comparing the black dots with the blue dots.
- Black dots: are real quantity of good results obtained. On the line that they describe, also red dots can be shown. This red dots indicate bad quality results obtained. Represents the productions taking into account the stops and the speed losses.
- Blue line: is the 100% production efficiency.
- Green line (above the orange line): this is the green target. If black dots (good results) are above this line, the process will be shown green.
- Orange line (at the bottom): this is the yellow target. If black dots (good results) are below this line, the process will be shown red.
- Path: is defined as the space between the upper blue line and the yellow/orange lower line. The work, or the production (good results) must follow the path defined by this upper and lower lines.
NOTE: the objectives are established by each client.
CONSUMPTION PATH:
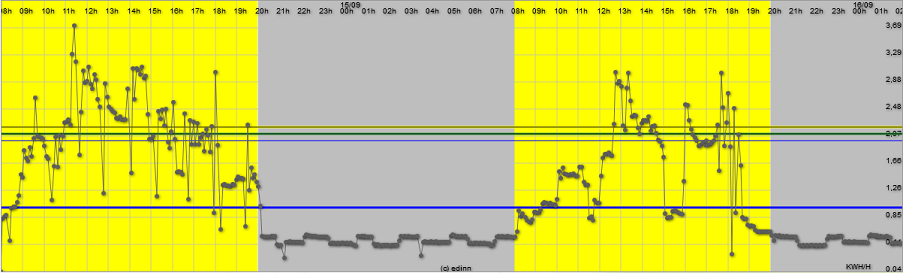
This "path" shows:
- X axis: shows the time passed.
- Y axis: shows the quantity of consumption (kWh in the image).
- Color areas: are the statuses that the process has passed. Please refer to the color codes of statuses.
- Grey dots: are the real quantity of consumptions.
- Blue lower line: is the 100% consumption efficiency.
- Yellow line (at the top): this is the yellow target. If grey dots are above this line, the process will be shown red.
- Green line (below the yellow line): this is the green target. If black dots (good results) are below this line, the process will be shown green.
- Blue upper line (below the green line): that is the expected maximum of consumption.
- Path: is defined as the space between the upper green line and the lower blue line.