Diagnosis
This report shows if the organization is using correctly the edinn platform.
These are the first 3 factors to determine if an organization is using the edinn platform correctly:
- Users justify failures.
- Users justify failures in the time they have for this.
- Real cycle times are not faster than those configured in edinn.
This report analyzes these 3 factors, and shows:
- Percentage of not justified statuses in the period: indicates the percentage of the stops detected by edinn which have not been justified by electrical signals nor users. Red color means that should be improved.
- Percentage of statuses justified after the registers were locked: indicates the percentage of the stops that were justified by a human supervisor after they were blocked to the user because of too much delay (in minutes, field Lock in the processes configuration) in the justification.
- Percentage of results with incorrect (higher than theoretical maximum) speed in the period: indicates the percentage of results (also known as products, parts or references) which average cycle time was faster than the maximum theoretical configured in edinn. Red color means that it should be improved.
- Additionally, this report shows the evolution of the OEE for the selected processes and areas and the chosed period.
An example of this report is shown below:

To improve these 3 factors, we recommend these 2 steps:
- Achieve that all results have a correct theoretical maximum cycle time. Verify that your results are configured in edinn with a correct maximum theoretical cycle time (theoretical speed), and correct them if they are not correct, comparing with the actual speed. You can correct the theoretical maximum cycle time (Cycle Time and Cycle Units) here.
- Achieve that users justify all PENDING stops. For this, your edinn software and operation terminals should be fully operative, and your users should follow these steps.
To compare the actual speed with the theoretical speed, you can use the Path graphic, which is shown in:
A) The terminal, in the main window.
B) The web reports, in the Path report.
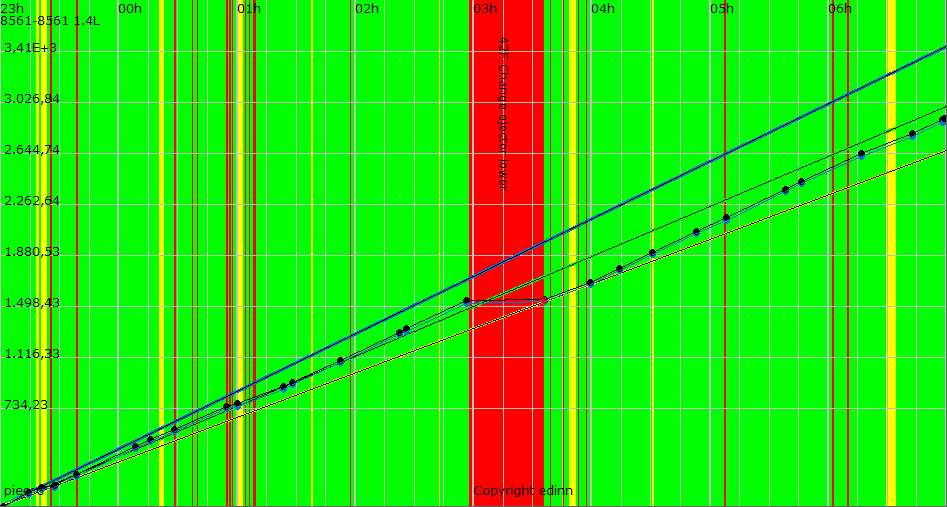
In the path graphic, the black dots are real production and the blue dots are theoretical production at the maximum speed. Therefore, the black dots should never be above the blue dots. If black dots are shown above the blue dots, that means that the cycle units / time are not configured correctly, and actual speed of process is higher than that configured in edinn. Please see the example below, where black dots are slightly above blue dots, but the difference is so little that this is consider acceptable.
To obtain further help, you can contact support.