Quality
Main Window > Quality
Utility: allows you to view and manage the data of the production process variables in order to perform the quality control by using the SPC (Statistical Process Control) methodology.
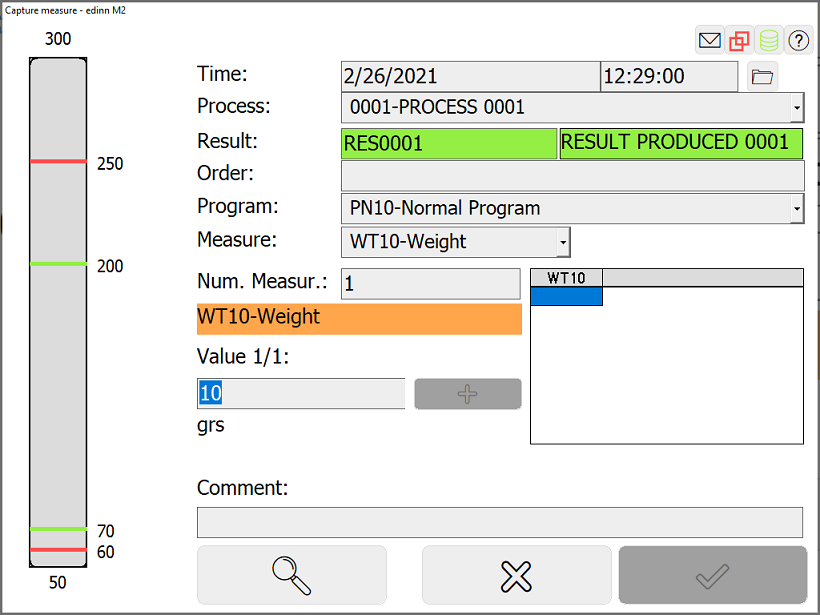
MEASUREMENT BAR:
On the left, it is shown a bar with the following parameters:
- A scale: (-1,1)
- The average value: the height of the bar.
- Green lines: the control limits.
- Red lines: the limits specified by the client.
NOTE: If the value is out of the scale, the whole bar will be shown in a grey color.
SPC SELECTORS (from left to right and from above to below):
- Time selector: select the period for which you want to impute SPC data.
- Process selector: select the process for which you are going to introduce the SPC data.
- Result selector: introduce the code or select the result (product) for which you are going to introduce the SPC data.
- Order selector: introduce the order for which you are going to impute the SPC data.
- Program selector: select the SPC measurement programme.
- Table: in the table on the right, you will see the average values of each measure for the specified program. If there is only one measure, a vector will be shown. If not, the table will show a matrix.
- Measure selector: if the programme allows you to realize measurements for different measures, then we can select the measure we are going to take. If not, this selector will be blocked and the window will allow us to fill out a matrix to take the measurements, in stead of a vector.
- Value field: here we should introduce the average value of each of the measures (3 on the image). Click
 to insert the value on the table.
  : through this button we can find SPC data that are measured at other moments or for other processes.
SPC OPERATIONS (according to the SPC standard):
- If any value outside the control limits is introduced, we will be asked to justify this and we can optionally leave a comment.
- If 7 or more consecutive points are introduced in increasing or decreasing order, an alert will be shown and a justification will be asked.
- If 7 or more consecutive points are introduced above or below the average between the upper and lower control limits, an alert will be shown and a justification will be asked as well.