Histogram
This report shows the SPC Histogram graphic from data of the quantitative quality analysis (SPC) and its limits.
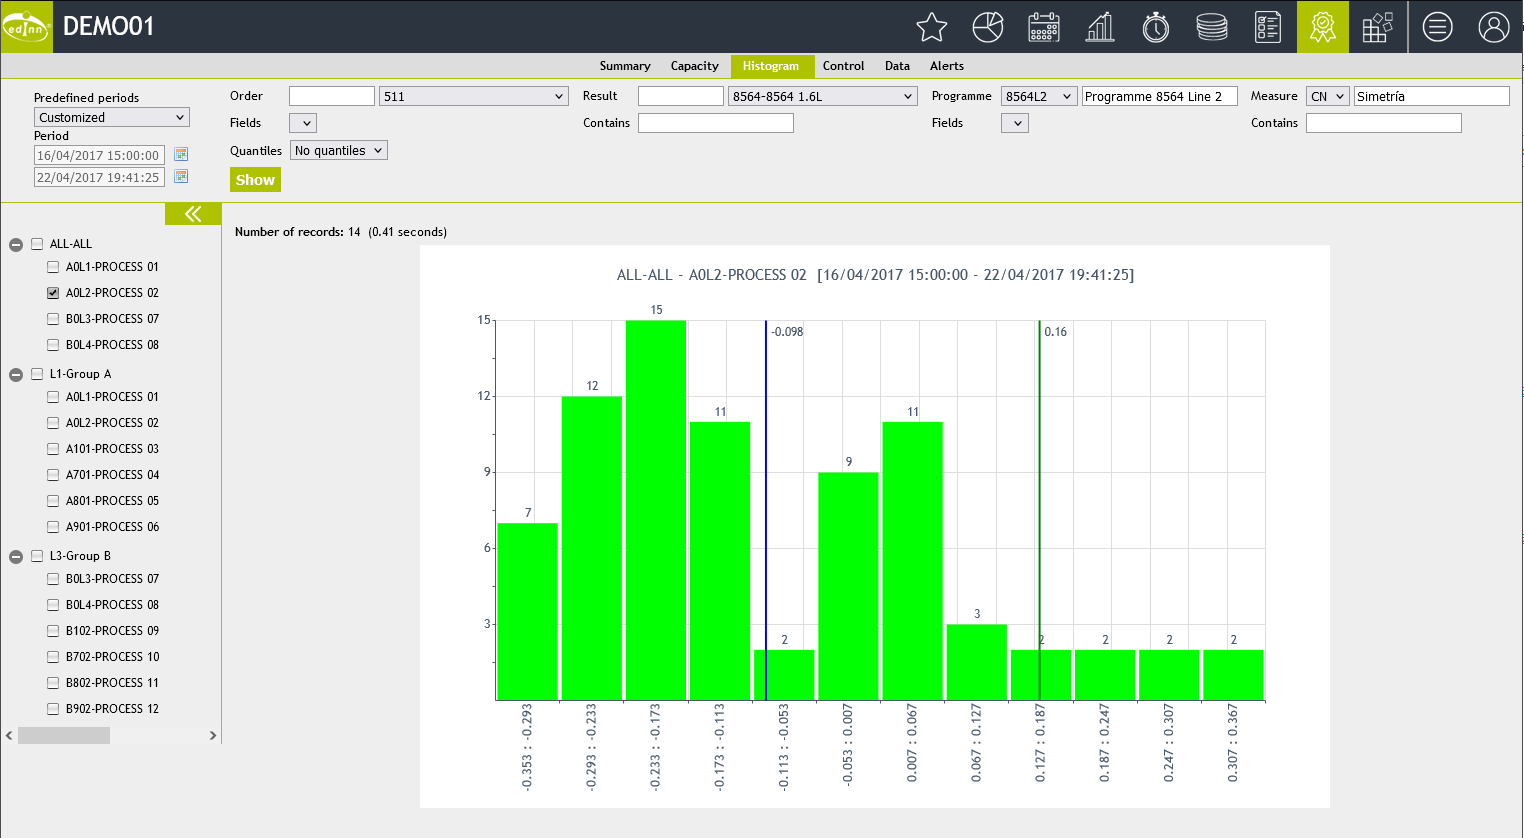
Selectors are:
- Please see: "Common aspects"
- Order: filter and select the order.
- Result: active result.
- Programme: select the programme.
- Measure: select the measure.
- Fields: select the field you want to filter with.
- Contains: type the content of the previous field to filter.
- Quantiles: allows you to select whether you want to represent the values as quantiles. The options are: Without quantiles (frequency histogram), Quartiles, Quintiles and Deciles.