Panel
This report shows different panels of aggregated information.
Selectors are:
- Please see: "Common aspects"
- Type: see below.
- Team: To see the information only regarding the time when a specific team worked.
- Device: allows to select the device from which its customized data will be taken. This selector is only shown for certain types of panels.
- Ratio Type: allows to select the ratio for the bars graphic, from OEE, PE or both ratios.
- Hide Header (Data): allows you to view the data table without the header.
- View (Data): view the data table as a bar graph. Data with different units cannot be displayed together.
There are these types of panels:
- Complete
- Evolution
- Data
Let us see the different types of panels.
Complete
This report shows the main production data and the following graphics, in one page:

- OEE, PE or both ratios and their components.

- The losses pie.
- The paretto of the idle time usages.
- The paretto of the stops.
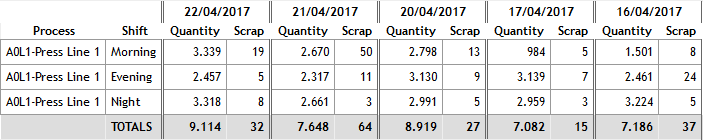
Evolution
This report shows the evolution per day and shift of production and scrap quantities.
Data
This report shows different data which can be selected from a list.
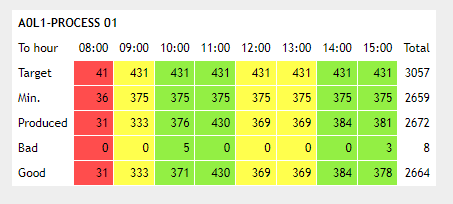
Hourly board
This report shows, in a table, the indicators configured from the server, grouped by the hour. The first row shows the 100% target, the second row shows the green or yellow target for the same indicator. The third row shows the total production, the fourth row shows the defective production, and the fifth row shows the good production. The colors indicate the level of achievement of the targets.