Quality and SPC
The QUALITY AND SPC module helps the organizations to:
- Increase the quality of the processes: with a tool that allows to measure automatically, manual or semi-automatic, the quality of the processes, without limitation of variables, in real time, or past, and following easily methodologies as SPC (Statistical Process Control).
- Overcome the most exigent certifications and audits: as they are exceeded every year by our users in industries, for example, from the automobile and power sectors.
- Register all the data automatically in a visual form.
- Improve the organization´s profitability and competitiveness.
- Reduce the possibility that defect products or services reach clients.
- Make production more efficient because there is nothing more inefficient then producing a product that will be rejected in the end.
- In some cases improve production security.
MODULE FUNCTIONALITY:
- Provide a software tool to automatically capture production context data (pressure, temperature, etc.), quality parameters, or perform Statistical Process Control (SPC)
- Define as much quality variables as needed.
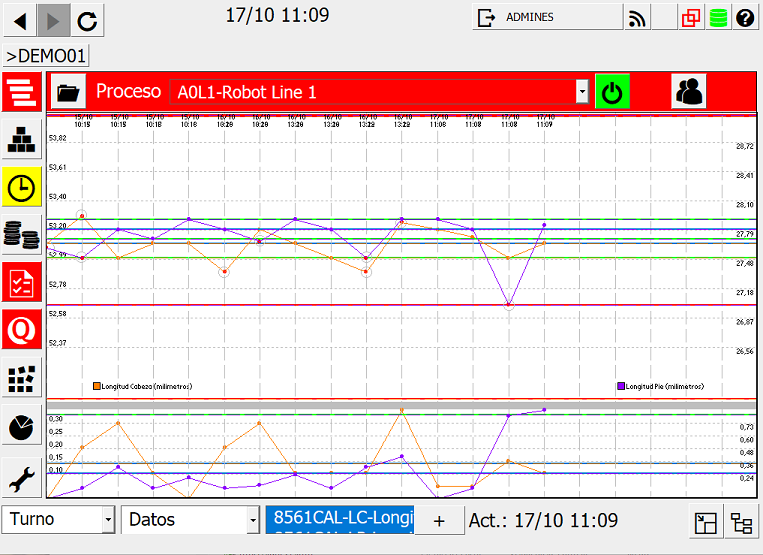
- Visualize, in real and historical time, from any device, the status and evolution of the quality variables measured. Obtain and visualize automatically the main quality ratios such as: CPK, Kurtosis, Skewness, Coeff. of Variance, etc.
- Visually shows the evolution of quality parameters, to detect and correct problems as soon as possible, minimizing losses by non-quality.
- Anticipates and automatically notifies of no-quality situations: ascending or descending points, over the average, etc.
- Visually notifies the user when he needs to carry out quality autocontrol tasks or when he should take measurements of quality parameters. Also allows to inform the user on process quality and actions to take to correct the process and avoid non-quality situations.
- edinn® M2 system can require users to justify quality problems, and keeps all the log data electronically.
- Interactive graphics: get more information by clicking on a measure, to obtain the context information, such as: quality variables, who took the measure, if there is a justification for the measure...
- Compare 2 quality variables to detect influences between both.
- Can be combined with workflow, incidence management and task approval with quality verification.
- Zero papers: access to electronic documentation or other applications linked to any element of the system: machines, incidents, maintenance and procedures, quality, etc.